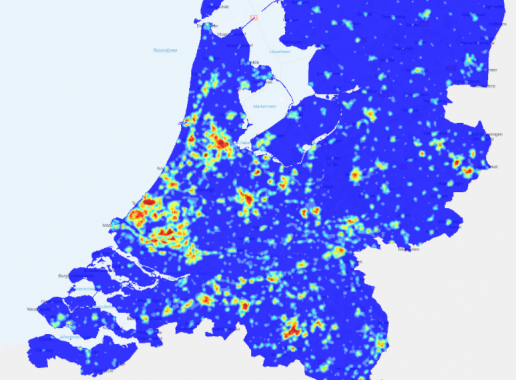
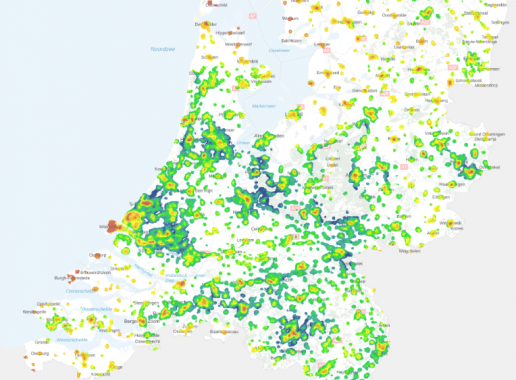
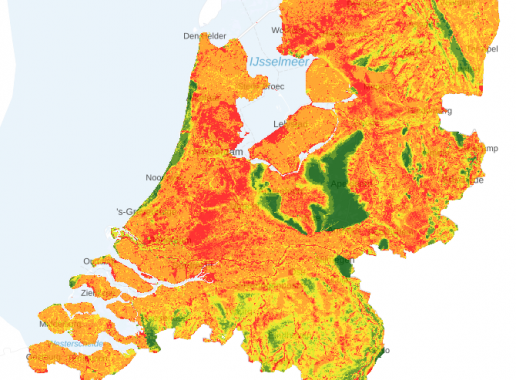
Natuurbrand
In tijden van droogte komen natuurbranden sneller voor. Waar in Nederland kan een natuurbrand voorkomen?
Kaarten over hitte
Apparent temperature
On a summer's day, it can feel even hotter than the temperature on the thermometer indicates.
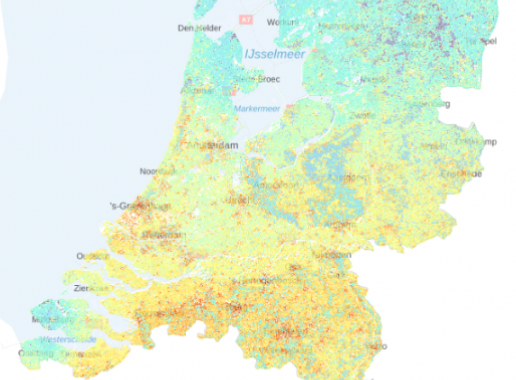
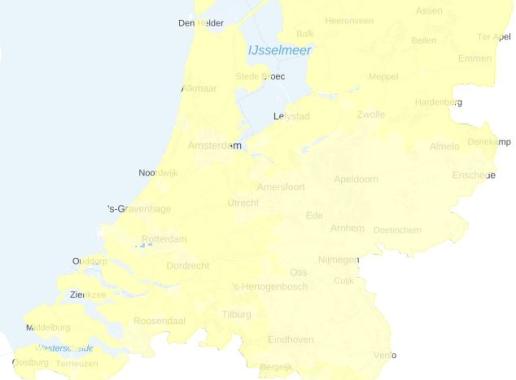
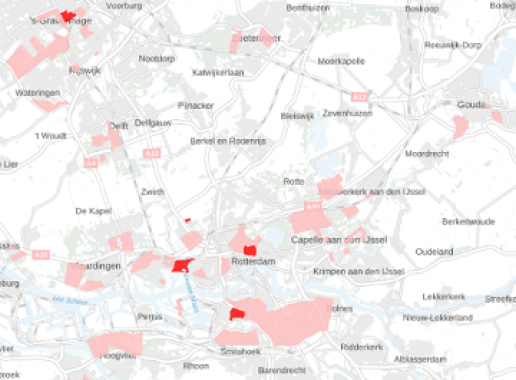
Heat map
The temperature in cities is higher than in surrounding villages and in the countryside. How warm does it get in your area?
Schaduw
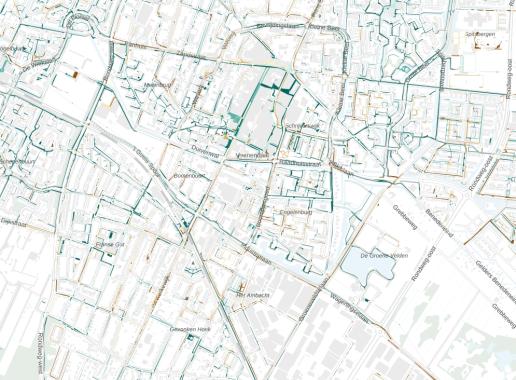
Op deze kaart zie je waar veel of weinig schaduw is op fiets- en wandelpaden aan het einde van de middag. Stippel een route uit die verkoeling brengt op een zomerse dag.
Kaarten over veel regen
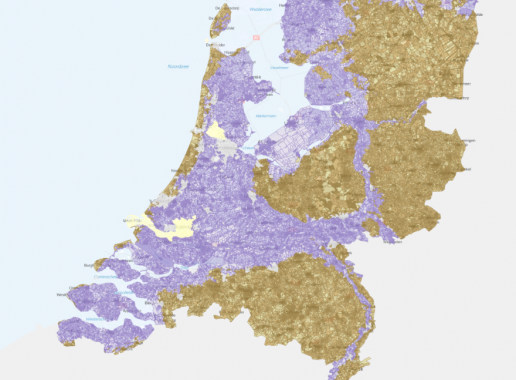
Kaarten over overstroming
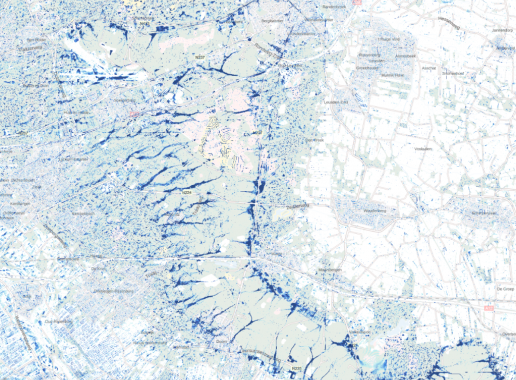
Floods
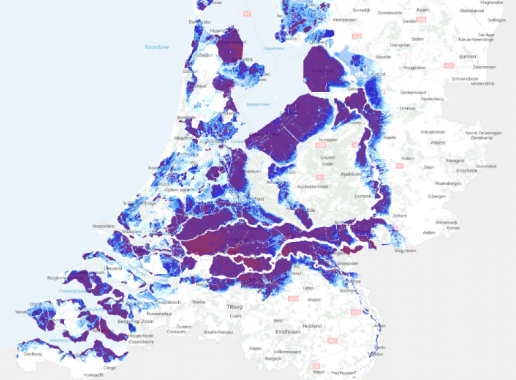
This map shows where and how deep the Netherlands will be flooded if the primary water defences break.
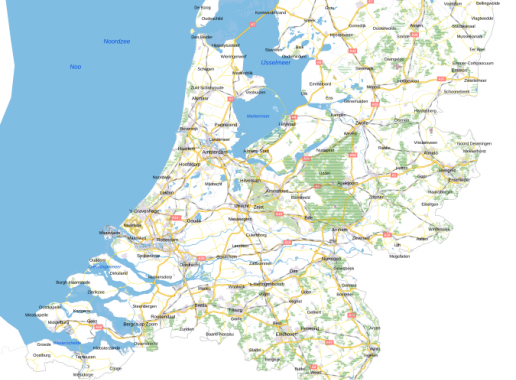
Where will it stay dry?
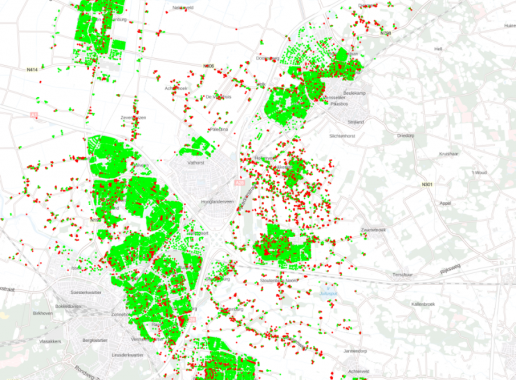
Which building has a dry floor where I can take shelter if there is a threat of flooding?
Dikes
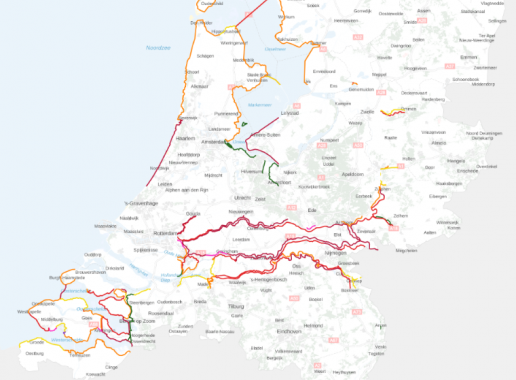
The map shows the dikes of the Netherlands with the various protection levels (in different colours).
Kaart over klimaatstresstest
Liveability of areas
In which neighbourhoods are the opportunities for tackling climate change the greatest and do win-win situations arise?