Good air quality is important for our health because everyone needs oxygen. However, traffic and industry mean we also breathe in hazardous substances such as particulate matter and the gas nitrogen dioxide. Agriculture and households also cause air pollution. One example is wood burning. In addition, some air pollution in the Netherlands comes from abroad. Conversely, some of our air pollution ends up in other countries. Thanks to a variety of policy measures emissions of hazardous substances has decreased significantly since 1990. Nevertheless, people can still become ill or die prematurely due to air pollution.
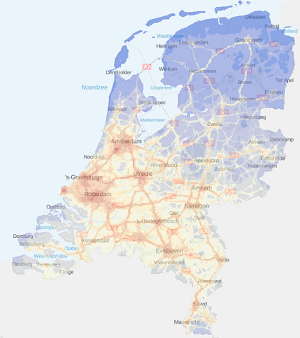
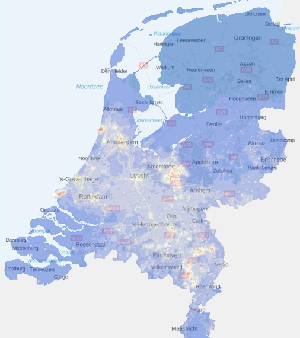
Nitrogen dioxide Particulate matter
Concentrations of nitrogen dioxide are highest along major roads and in town and city centres. On the map for particulate matter you can identify the locations of livestock and other extensive industries, in addition to traffic.
Limit values
In order to limit the harmful effect of air pollution, the government sets limit values for polluting substances. This has led to an improvement in air quality in recent years. Extra measures are being taken to resolve the problems that still exist in the Netherlands. The expectation is that the Netherlands will actually meet these limit values as a result of these measures before the end of 2018. However, even if the legal limit values are achieved, health problems can still arise or worsen. That is actually even the case when there are low quantities of particulate matter and nitrogen dioxide. What is more, the quantity of air pollution is still high in some places or at certain times of the day. It is responsible for around 3% of the total burden of disease in our country. In order to reduce health risks even further, the Clean Air Agreement is intended to ensure that we meet the exposure limits of the World Health Organisation.
Odour nuisance due to wood smoke, cattle farms and industry
You cannot usually see or smell directly how clean the air is, unless your neighbours have, for example, just lit the barbecue or if an old moped drives by. These may not only generate odour nuisance but also acute health problems or concerns about the issue. Odour nuisance due to activities by the neighbours is the most common form of nuisance. This includes barbecues, fire baskets, fireplaces and multi-burner stoves. The nuisance is often accompanied by annoyance due to noisy neighbours. The Wood Smoke and Health platform puts forward various solutions to limit nuisance. One of those solutions is to raise awareness about the health effects.
Large cattle farms and industry sometimes produce odour nuisance as well, although it has decreased at a national level. Nevertheless problems can still occur at certain locations and times of the day.
How clean is the air now?
RIVM and other parties continuously measure air pollution at various locations. RIVM uses the measurements to calculate the state of air quality throughout the Netherlands as a whole. They are also used to make predictions for levels tomorrow and the day after tomorrow. The Atlas has separate maps for particulate matter, nitrogen dioxide and ozone, but also for mixtures of these substances. That is referred to as the so-called 'air quality index', which indicates whether it is good, mediocre, insufficient, or bad for health. The index was developed in order to inform people in time about possible health effects. In this way, sensitive groups will know, for example, that they should stay inside at certain times.
How clean is the air in general?
In addition to up-to-date maps, we also have maps on the average quantity of air pollution per calendar year. We create these on the basis of official, legally valid data. The fact that a large amount of data and checks are necessary means that it takes more than a year for this data to become available. The most recent annual average maps in this Atlas therefore date from 2017.
Measurements by the public
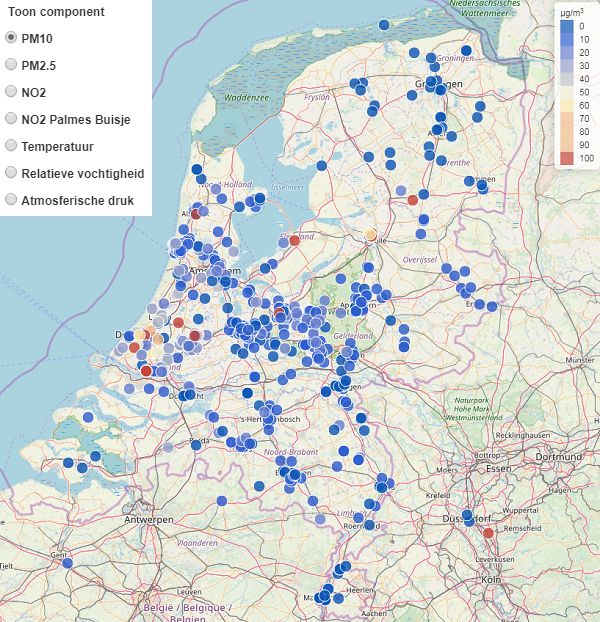
The technology for measuring air quality is changing very rapidly at the moment. These days anyone can take their own air quality measurements with cheap 'sensors'. RIVM is investigating the operation and use of these sensors. You can find real-time measurement data from the public and a comparison with official measurements at this data portal.
The website measure together has also been set up to share experiences and results. It addresses frequently asked questions, such as: 'what is the best way to measure', 'who else is using these methods' and 'what can you learn from the measurement results'? For example work is being done on an air quality measurement network which everyone can contribute to.
Health benefits due to cleaner air
Air pollution can cause and exacerbate respiratory complaints and cardiovascular conditions. It may also lead to lung cancer. Air pollution therefore contributes significantly to disease and mortality in the Netherlands. It is responsible for around 3% of the burden of disease. That is similar to the health risks posed by obesity and too little physical activity.
A lot of measures have been taken nationally and internationally to improve air quality. These measures have made the air a great deal cleaner. However, even lower concentrations of air pollution can affect people's health. The Health Council therefore recommends further reducing air pollution in the Netherlands. This means reducing the quantity of particulate matter and nitrogen dioxide from road traffic (particularly diesel vehicles). The Council also advocates less ammonia which is released when spreading manure, for example. This can, in fact, also be a source of particulate matter. The Health Council of the Netherlands recommends reducing the quantity of particulate matter to below the exposure limits of the World Health Organisation, which are twice as strict as the European limit values.
Protect sensitive groups
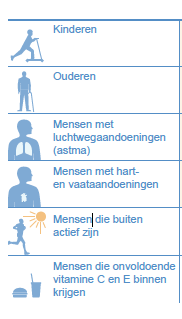
The Health Council of the Netherlands recommends protecting vulnerable groups (see diagram). For example, facilities for children and elderly people should not be built close to busy roads. Advice on behaviour can also help. In that respect the maps with real-time values and predictions are important. During periods of smog due to ozone build-up it is, for example, better not to engage in any sporting activities in the afternoon. RIVM issues warnings when smog is expected.
Groups that are vulnerable to air pollution (source: Report of the Health Council of the Netherlands).
Read more about the health effects, limit values and exposure limits on our pages about the individual substances of particulate matter, nitrogen dioxide and odour nuisance.
Environmental Management Act
Air quality must comply with European limit values. That is stipulated in the Environmental Management Act. In the National Air Quality Cooperation Programme the state, the provincial governments and the municipalities collaborate in order to resolve breaches of the legal limit values. Progress is reported on every year. The calculated concentrations in most parts of the Netherlands are now below the limit value. The limit value for nitrogen dioxide was exceeded several times in 2016 at locations where there was a lot of traffic. The limit value for particulate matter was still being exceeded locally near large livestock farms. With regard to nitrogen dioxide the Netherlands has had to fulfil the legal limit values everywhere since 2015. In the case of particulate matter this has officially been an obligation since as long ago as 2012.
Extra measures for problem areas
In 2018 the Ministry of Infrastructure and Water Management announced extra measures to reduce air pollution at locations where the limit values are still being exceeded. Examples include measures to promote cycling, minimising vehicle traffic in inner-city areas, green zones and electric transport. Rotterdam is, for example, focusing on reducing the amount of traffic using the Maas Tunnel corridor and Amsterdam aims to introduce electric taxis. These measures are being added to the NSL.
Clean Air Agreement
In order to keep reducing the health risks due to air pollution, work is being done on the Clean Air Agreement. In order to keep reducing the health risks due to air pollution, work is therefore being done on the Clean Air Agreement. The focus is on a permanent improvement in air quality by working towards levels below the exposure limits of the World Health Organisation. In the case of particulate matter, for example, these are two times lower than the European limits. The basis for this are the recent recommendations of the Health Council of the Netherlands entitled 'Health benefits due to cleaner air'.
Netherlands Pollutant Release and Transfer Register
Air pollution is monitored to see whether we in the Netherlands are meeting the limit values. That is done on the basis of the Netherlands Pollutant Release and Transfer Register which keeps a record of the emissions of contaminated substances released into the air, water and soil, for example by companies providing information on their emissions and by local authorities municipalities providing data on the amount of traffic using local roads. After that the quantity of air pollution is calculated. The fact that a large amount of data and checks are necessary, means that it takes more than a year for this data to become available. The data was made available in 2018 in order to determine the most important sources per municipality.
Spatial plans
It is laid down by law that the possible effects on air quality must be determined when drawing up spatial plans. There is, for example, policy on 'Sensitive developments' which stipulates that facilities for children and elderly people should not be built at locations with high levels of air pollution. The Municipal Public Health Services recommend that no schools should be built within 300 metres of a busy road.
The government has to take various factors into account and weigh up the importance of protecting both public health and economic interests. Some plans have failed to come to fruition due to the air quality requirements. Other plans do go ahead despite the fact that they can have a detrimental effect on air quality. If the various parties are unable to reach an agreement, plans are sometimes also submitted to the Council of State.
Recommendations to reduce health problems
- Running and cycling are, of course, good for you. However, it is preferable not to run or cycle along a busy road.
- Are you going to move house? If so, choose a location which is at least 50 metres from a busy road and at least 100 metres from a motorway.
- Keep the windows closed on the road side of your house and during the rush hour.
- Are you looking for a day care centre for your child? Or a school? If so you should not choose a location near a busy road or motorway.
- You can use 'check your location' to see the air quality in your neighbourhood. You can also use the website Air Monitoring Network. This website also provides advice and forecasts for the next few days.
- It is better not to do any sport in the afternoon if smog is expected.
Taking measurements yourself
You can also measure air pollution yourself now that various low-cost sensors are available. People have also started setting up monitoring networks in their own municipalities, for example in Zeist. RIVM has also set up a Measure air quality together website to share experiences and results. It addresses frequently asked questions, such as: 'what is the best way to measure', 'who else is using these methods' and 'what can you learn from the measurement results'?
Measuring points of the government and citizens (click on the map for an up-to-date overview)
Keeping clean air yourself
- Walk, cycle or use public transport as much as possible. Alternatively you should use a cleaner (shared) car. Drive at 100 rather than 130 km per hour which will save fuel as well.
- Do not use a fireplace or fire basket. If you do want to make a fire, apply the 10 fire making tips.
- Eat less meat. Livestock farms cause a lot of local air pollution.
- Use videoconferencing and work from home more frequently.


